
Supply Forecasts Trump Near-Term Demand Drivers
This past winter, natural gas prices and implied volatility in the NYMEX futures market exhibited a notable pattern shaped by weather conditions and market expectations. As the heating season approached, prices and volatility peaked in anticipation of increased demand for heating (arrow 1). However, the winter turned out to be milder than expected and prices and volatility began to decline, reflecting the decreased heating needs and surplus supply (arrow 2).
As spring arrived, the market experienced a brief rally, which was strongly correlated with early hot weather conditions. However, this rally was short-lived (arrow 3).
Despite temperatures continuing to stay above normal, both prices and implied volatility have been on a downward trajectory since late spring (arrow 4). The key factor contributing to this trend is the market’s anticipation of entering the next winter with high inventory levels.
The discount (contango) on the NYMEX October 2024 contract (the final contract of the summer strip) to the November 2024 contract (the first contract of the winter strip) averaged $0.420 per MMBtu last week, a five-month low. The takeaway is traders seem to be factoring in the expectation that inventory will remain robust, thus mitigating the risk of supply shortages and keeping prices and volatility low.
Recent movements in the nat gas markets are a reflection of how short-term demand fluctuations due to weather can impact prices and volatility, but ultimately, long-term expectations of inventory levels play a more significant role. The mild winter left inventories high, and despite strong current demand due to hot weather, the market anticipates that these high inventory levels will persist into the next winter.
Algonquin citygate
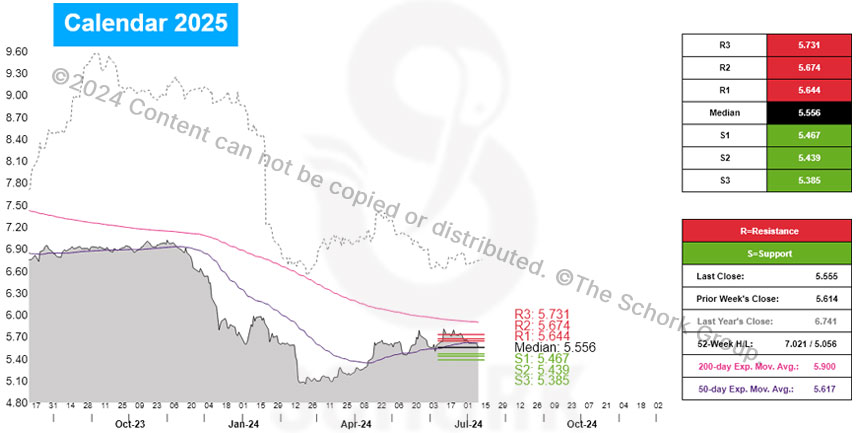
The trend is flat with the market trading below the 50-day and 200-day exponential moving averages. It’s advisable to secure upside exposure at current levels.
For the week ahead, consideration of layering in a hedge position should begin on a retracement to our initial support of $5.467.
ISO NEW ENGLAND
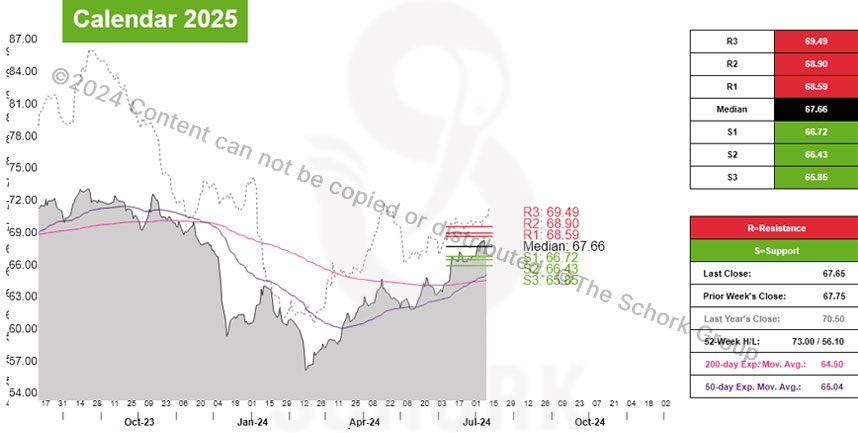
Cal 2025 RTC power has moved higher in 8 of the last 10 weeks by an average of 0.9%. The strip was last assessed at $67.65 per MWh.
The trend is higher, with prices above the 50-day and 200-day exponential moving averages. Wait for a retracement before acting.
For the week ahead, consideration of layering in a hedge position should begin on a retracement to our initial support of $66.72.