ENERGY PRICES WERE MIXED YESTERDAY… gas rallied through the expiry on October options (the futures expire today) while oil shook off a bullish update from the EIA.
What We Are Watching
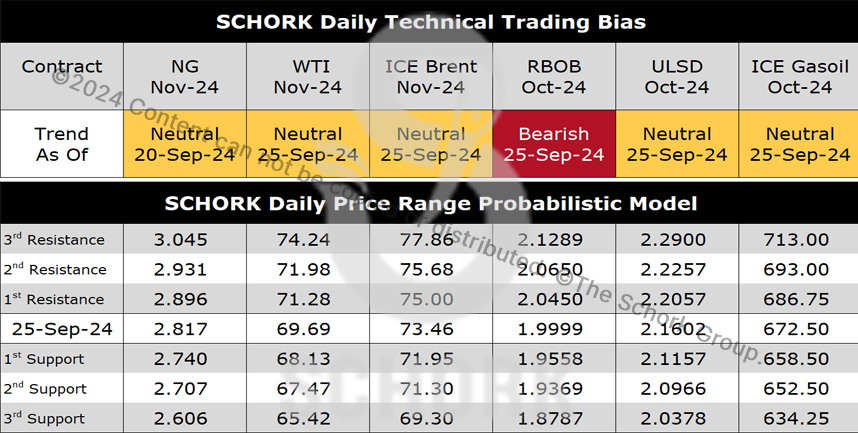
Our summer NYMEX WTI model ran through last Friday’s contract expiry for October. Late last month, the market peaked $0.08 above our model’s $77.34 first standard deviation and a couple of weeks ago the market bottomed $2.22 below the $67.97 second standard deviation.
Last Wednesday, we noted a 92% probability that themarket would expirebetween our model’s first and secondstandard deviations, with a 0.4% chance of finishing above$77.34 and a 7.7% chance of expiring below $67.97. In hindsight, the market expired last Friday between these two limits at $71.92. Next week we will publish our NYMEX WTI and ICE Brent models for fall.
Yesterday, the EIA issued a BULLISH update in its weekly petroleum status update, because of abnormally large draws in the products. For the week of September 20th, total crude oil stocks fell by 4.47 MMbs, net of a de minimis 0.12 MMb build in the all-important NYMEX, Cushing complex. Gasoline and distillate stocks fell by 1.54 MMbs and 2.27 MMbs, respectively.
As illustrated at the top of page one, the normal week-over-week change for the middle of September in the EIA data is a 1.7 ± 2.7 MMb draw in crude oil, including a 0.5 ± 0.6 MMb draw from Cushing. Gasoline stocks typically fall by 0.6 ± 1.4 MMbs and distillates usually gain 0.6 ± 1.1 MMbs. Netted out, we should see a draw of 0.5 ± 5.2 MMbs in the three headline markets.
Total crude oil stocks fell in 6 out of every 7 weeks this past summer by a net of 47.65 MMbs, the 21st largest draw since 1982! As of last Friday, inventories stood at a 2½-year low of 413.04 MMbs.