
When Will Gas Peak For the Winter?
The NYMEX natural gas market is notorious for its counterintuitive pricing patterns, with peaks often occurring well before winter’s coldest days. In short, it is the consummate contrarian’s contrarian market. Understanding this seasonal trend is essential for hedgers looking to time their purchases effectively.
Historically, natural gas prices tend to peak early. In 27 of the last 34 winters (79% of the time), the highest price occurred before the end of the year. Specifically:
- 32% of the time, prices peaked before October
- 18% in October
- 15% in November
- 15% in December
On average, the highest price hits around September 15th, 14 weeks before the winter solstice. For the remaining 21% of winters, the peak happens in January, February, or March, with an average late peak around February 25th.
Winter 2024-25 Outlook
In 2024, the pattern remains consistent. Since April, the NYMEX natural gas market peaked on June 11th at $3.159 per MMBtu. Based on the past 34 winters, there’s a 32% chance this was the high for the upcoming winter, and a 79% chance prices will peak before 2024 ends.
Historical Precedents
The last time natural gas prices peaked after December was in winter 2017-18, with prices reaching $3.661 per MMBtu on January 29th, 2018. In the six winters since, the highest prices were posted between August and November, including last winter’s high print which was set on Halloween 2023 at $3.630 per MMBtu.
Conclusion
If you are planning to purchase natural gas for 2025, consider locking in your prices now. With historical data showing that natural gas prices are likely to peak before the end of the year, waiting until after January may not offer the best opportunity. The odds favor acting sooner rather than later to secure favorable pricing.
Algonquin citygate
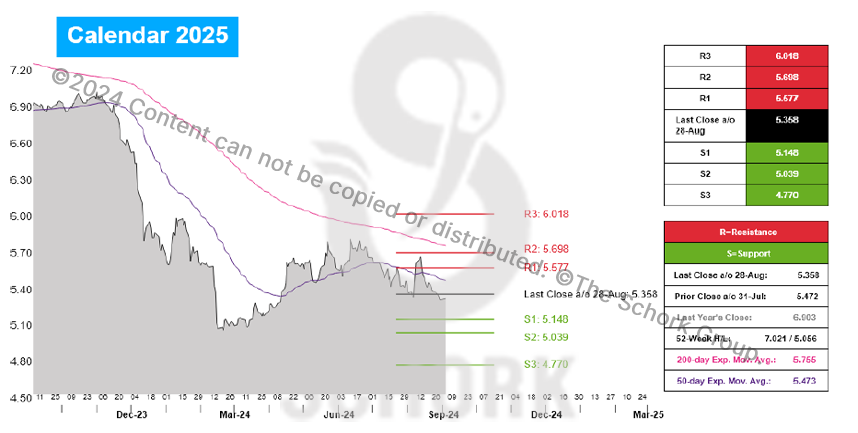
Cal 2025 gas moved lower in August and finished the month at $5.358. The support targets for September based on this close are $5.148, $5.039, and $4.770. The resistance targets are $5.577, $5.698, and $6.018.
The trend is falling with prices trading below the 200-day ($5.755) and 50-day ($5.473) EMAs. For the month ahead, consideration of layering in a hedge position should begin on a retracement to our initial support of $5.148. A break below our second support of $5.039 indicates a good hedging opportunity.
ISO NEW ENGLAND
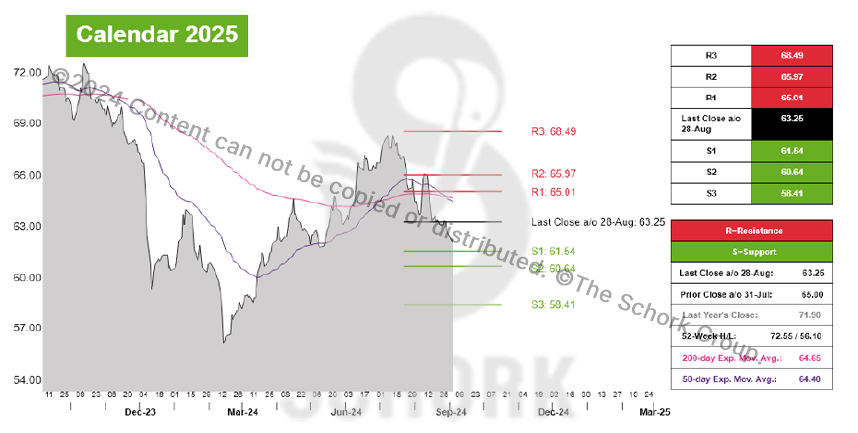
Cal 2025 RTC power moved lower last month and finished at $63.25. The support targets for September based on this close are $61.54, $60.64, and $58.41. The resistance targets are $65.01, $65.97, and $68.49.
The trend is falling with prices trading below the 200-day ($64.65) and 50-day ($64.40) EMAs. For the remainder of the month, consideration of layering in a hedge position should begin on a retracement to our initial support of $61.54. A break below our second support of $60.64 indicates a good hedging opportunity.